Business challenge
An AI platform for real estate professionals running 80+ intelligent tools—virtual staging, image enhancement, and AI-powered transformations—was collapsing under production load. The technology worked in demos, but failed at scale.
AI inference workloads running on on-premises GPU VMs hit critical bottlenecks under concurrent traffic. GPU utilization pinned at 100%. Response times ballooned from seconds to 40+ seconds. Users abandoned tasks mid-process. The single-VM architecture couldn’t scale horizontally, and any maintenance meant complete platform downtime.
The challenge wasn’t the models—it was the infrastructure. Legacy on-prem VMs with outdated GPUs, no orchestration layer, and zero elasticity. The migration to cloud required more than just lift-and-shift: it demanded GPU-optimized infrastructure with auto-scaling, multi-AZ availability, deep performance visibility, and—critically—experts who could select the right GPU hardware. Choose wrong, and the cloud deployment would replicate the same bottlenecks at higher cost.
Solution
We designed a cloud-native AI inference platform on AWS EKS that transformed the platform from a fragile, single-VM deployment into a resilient, high-performance, GPU-powered Kubernetes environment. But success required solving a critical challenge first: choosing the right GPU hardware.
The migration path seemed straightforward—containerize the models, deploy to EKS with GPU nodes, configure auto-scaling. But the choice of GPU instance type would make or break the entire platform. Choosing the wrong GPU hardware would mean paying cloud prices for on-prem performance.
Rigorous performance validation and GPU selection
We approached this as an engineering problem requiring empirical data, not guesswork. The team deployed a test EKS cluster with AWS EC2 G5 instances (NVIDIA A10G GPUs)—the obvious first choice for many AI workloads. The containerized models deployed successfully. Initial single-request tests looked promising.
Then came load testing. Using Locust, a modern load testing framework, the team simulated realistic production traffic patterns: multiple concurrent users triggering image transformations simultaneously, sustained request rates matching expected peak usage, varied request types mixing different model sizes.
The results were clear and disappointing: average response time of 42 seconds under concurrent load. GPU utilization pinned at 100%. The G5 instances, despite being newer than the on-prem hardware, exhibited the same performance bottleneck. The NVIDIA A10G GPUs couldn’t process the large model inference requests fast enough to maintain acceptable latency when handling parallel requests.
The team pivoted to AWS EC2 G6e instances powered by NVIDIA L40S Tensor Core GPUs—a newer architecture with substantially higher tensor throughput, more GPU memory bandwidth, and optimizations specifically for large model inference.
The same Locust test suite ran against the G6e cluster. The difference was dramatic: average response time dropped to 15 seconds—a 64% improvement. More importantly, the cluster handled concurrent requests gracefully. GPU utilization stayed well below saturation. The platform could finally scale horizontally—adding more G6e nodes distributed load effectively instead of creating more bottlenecks.
This wasn’t luck. It was the result of methodical testing, deep understanding of GPU architecture differences, and choosing hardware matched to the specific computational patterns of large vision and language models.
Production-grade Kubernetes infrastructure
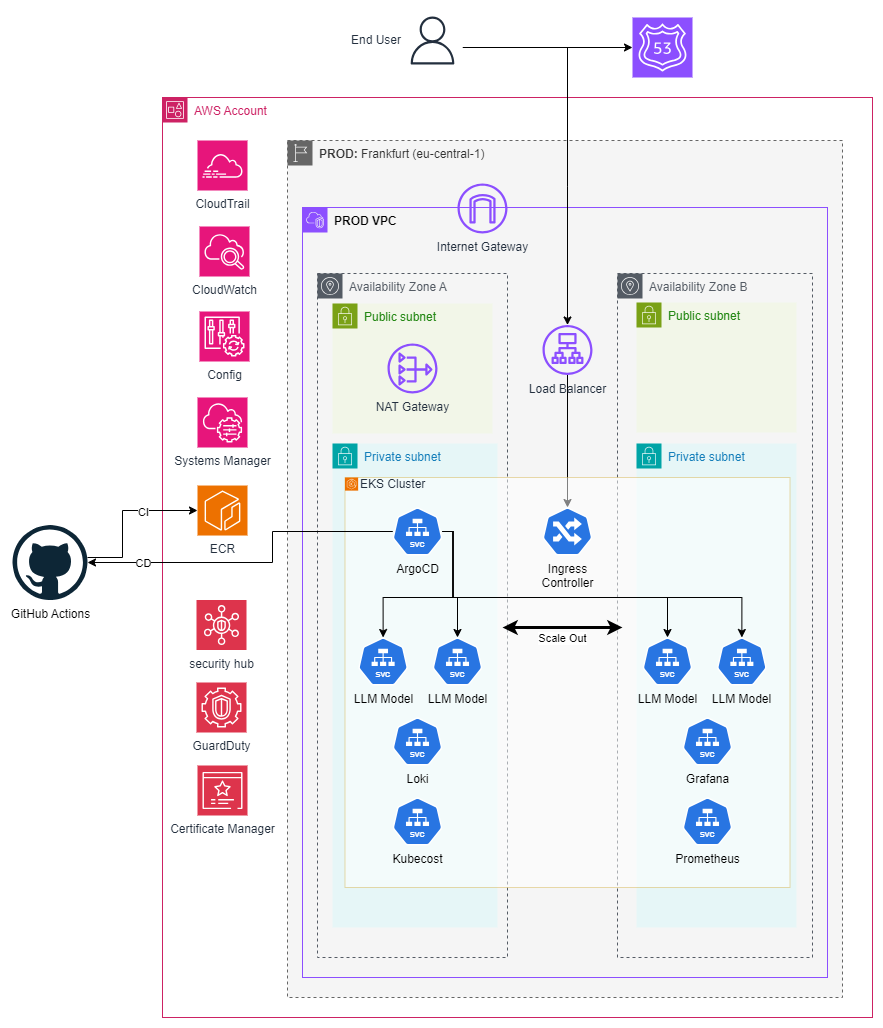
With the compute layer validated, we built a resilient EKS foundation. The cluster runs across two Availability Zones with EKS-managed node groups of G6e instances. Workloads are distributed across AZs for high availability—if one zone experiences issues, the other continues serving requests without interruption.
All nodes run in private subnets with no direct internet access. An Application Load Balancer in public subnets receives external traffic and routes it through an AWS Load Balancer Controller running in-cluster. This provides intelligent routing to the appropriate inference services based on request path and headers.
AWS Route 53 handles DNS with health checks, automatically failing over if the ALB becomes unhealthy. AWS Certificate Manager provisions and automatically renews SSL/TLS certificates, ensuring all traffic is encrypted end-to-end.
The cluster’s security posture is hardened through multiple layers: AWS Security Hub provides centralized security findings, AWS GuardDuty monitors for malicious activity and anomalous behavior, AWS Config continuously audits resource configurations against compliance rules, and IAM roles follow least-privilege principles with pod-level service accounts via IRSA (IAM Roles for Service Accounts).
GitOps automation with ArgoCD
We implemented a complete GitOps workflow that eliminates manual deployments and ensures the cluster state is always declarative and version-controlled.
GitHub Actions handles continuous integration: when developers commit code changes, automated pipelines build Docker images, run security scans, tag immutably, and push to Amazon ECR. But the images don’t deploy automatically—instead, manifests update in the Git repository.
ArgoCD runs inside the EKS cluster, continuously monitoring the Git repository for changes. When it detects an update to Kubernetes manifests (new image tags, configuration changes, scaling adjustments), it automatically synchronizes the cluster state to match the Git source of truth. Deployments are declarative, auditable, and reversible—rolling back is as simple as reverting a Git commit.
This GitOps pattern means the entire cluster configuration—every deployment, service, ingress rule, ConfigMap, and Secret—is defined in code. No manual kubectl commands. No “it works on my machine” discrepancies. The Git repository is the single source of truth, and ArgoCD ensures the cluster always reflects that truth.
Deep observability: from application to GPU silicon
One of our differentiators was implementing comprehensive observability that goes beyond typical Kubernetes monitoring—deep down to GPU hardware metrics that most teams never instrument.
Prometheus scrapes metrics from multiple sources across the stack:
- Kubernetes control plane and node metrics
- Application-level metrics from inference services
- Container resource utilization (CPU, memory, network)
- Custom business metrics (inference requests/second, queue depth, model-specific latency)
Grafana visualizes everything through unified dashboards. Operators can see cluster health, pod status, request rates, error rates, and latency percentiles at a glance. But the critical addition is GPU-level telemetry.
NVIDIA DCGM (Data Center GPU Manager) is deployed as a DaemonSet across all GPU nodes, exposing granular hardware metrics that Prometheus ingests:
- GPU utilization percentage per device
- GPU memory usage and bandwidth
- Tensor core utilization
- GPU temperature and power consumption
- NVLink throughput (for multi-GPU communication)
- PCIe bandwidth utilization
This GPU observability proved essential during the G5-to-G6e evaluation. The team could see in real-time that G5 instances were saturating GPU compute while memory bandwidth stayed underutilized—indicating a compute-bound bottleneck. G6e metrics showed balanced utilization across tensor cores, memory, and interconnect—confirmation that the architecture matched the workload better.
Loki and Promtail handle log aggregation, ingesting application logs, container logs, and system logs into a queryable data store. Logs are correlated with metrics in Grafana, enabling rapid troubleshooting—when latency spikes, operators can immediately pivot from the metrics dashboard to related log entries.
Kubecost provides granular cost visibility, breaking down AWS spend by namespace, deployment, and even individual pods. This enables the team to optimize resource allocation and rightsizing based on actual usage patterns.
Auto-scaling for burst workloads
AI inference workloads are inherently bursty. User activity follows daily patterns—peaks during business hours, quiet periods overnight. Marketing campaigns drive traffic spikes. Special events create unpredictable load surges.
We configured Horizontal Pod Autoscaling based on custom metrics—when request queue depth exceeds thresholds or when average GPU utilization across pods crosses defined limits, Kubernetes automatically spawns additional inference pods to distribute load.
But scaling pods requires available node capacity. Cluster Autoscaler monitors for pending pods that can’t be scheduled due to resource constraints and automatically provisions additional G6e nodes. When load subsides, it safely drains and terminates underutilized nodes to minimize costs.
This creates an elastic platform that automatically expands during demand and contracts during quiet periods—maintaining performance SLAs while optimizing infrastructure spend.
Key implementation highlights
- Validated GPU instance selection through rigorous load testing, achieving 64% response time improvement with G6e over G5 instances.
- Deployed production-grade multi-AZ EKS architecture with intelligent load balancing and comprehensive security integration.
- Implemented GitOps-driven deployment automation with ArgoCD and GitHub Actions, enabling rapid rollback capabilities.
- Achieved GPU-level observability by deploying NVIDIA DCGM alongside Prometheus, Grafana, and Loki for hardware telemetry.
- Configured elastic auto-scaling with HPA and Cluster Autoscaler to optimize costs and handle burst workloads.
- Hardened infrastructure with Security Hub, GuardDuty, Config, and least-privilege IAM policies at every layer.
Business impact
- Reduced AI model inference response time by 64%, from 42 seconds to 15 seconds through empirical GPU instance selection and load testing.
- Enabled high-concurrency scaling, eliminating queue backlogs and system failures under parallel user requests.
- Migrated from fragile single-VM deployment to highly available multi-AZ EKS architecture with 99.9% uptime.
- Achieved deep operational visibility with GPU-level metrics (DCGM) and application telemetry, enabling proactive issue detection.
- Automated deployment lifecycle through GitOps, reducing deployment time from hours to minutes with rollback safety.
- Optimized infrastructure costs through elastic auto-scaling that matches capacity to demand, eliminating idle GPU resources.
Industry relevance
This approach is applicable to:
- AI/ML platforms running image generation, computer vision, or LLM inference workloads on GPUs.
- Real estate technology and PropTech platforms offering AI-powered visual transformation services.
- GPU-intensive SaaS applications facing performance bottlenecks from improper instance selection or saturation.
- Organizations migrating AI workloads from legacy on-premise infrastructure to cloud-native Kubernetes platforms.
- Platforms requiring elastic GPU auto-scaling with comprehensive hardware-level observability (NVIDIA DCGM).
Scalable and high-performance AI/ML inference workloads running on AWS EKS powered by G6e GPU instances.